Short description of my research interest is “I do proteins” (I took this phrase from my friend Ana). I try to figure out what particular protein, protein family, or set of proteins does in the wider context. Usually I start where automated methods have ended – I have all kinds of annotation so I try to put data together and form some hypothesis. I recently realized that the process is basically visualizing different kind of data – or rather looking at the same issue from many different perspectives.
It starts with alignments. Lots of alignments. And they all end up in different forms of visual representation. Sometimes it’s a conservation with secondary structure prediction (with AlignmentViewer or Jalview):

Sometimes I look for transmembrane beta-barrels (with ProfTMB):

Sometimes I try to find a pattern in hydrophobicity and side-chain size values across the alignment (Aln2Plot):

Afterwards I seek for patterns and interesting correlations in domain organization (PFAM, Smart):

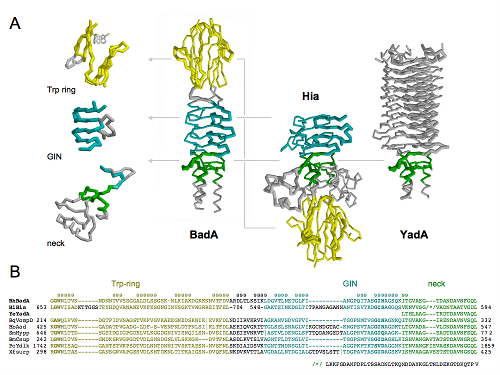
Sometimes I map all these findings onto a structure or a model that I make somewhere in the meantime based on found data (Pymol, VMD, Chimera):

I also try to make sense out of genomic context (works for eukaryotic organisms as well – The SEED):

I investigate how the proteins cluster together according to their similarity (CLANS):

And figure out how the protein or the system I’m studying fits into interaction or metabolic networks (Cytoscape, Medusa, STRING, STITCH):

If there’s some additional numerical information I dump it into analysis software (R, for simpler things DiVisa):

And I make note along the process in the form of a mindmap (Freemind, recently switched to Xmind, because it allows to store attachments and images in the mindmap file, not just link to them like Freemind does):
So it turns out that I mainly do visual analytics. I spend considerable amount of time on preparing various representations of biological data and then the rest of the time I look at the pictures. While that’s not something every bioinformatician does, many of my colleagues have their own workflows that also rely heavily on pictures. For some areas it’s more prominent, for others it’s not, but the fact is that pictures are everywhere.
There are two reasons I use manual workflow with lots looking at intermediate results: I work with weak signals (for example, sometimes I need to run BLAST at E-value of 1000) or I need to deeply understand the system I study. Making connections between two seemingly unrelated biological entities requires wrapping one’s brain around the problem and… lots of looking at it.
And here comes the frustration. I counted that I use more than twenty (!) different programs for visualization. And even if I’m enjoying monitor setup 4500 pixels wide which is almost enough to put all that data onto screen, the main issue is that the software isn’t connected. AlignmentViewer cannot adjust its display automatically based on the domain I’m looking at or a network node I’m investigating – I need to do it by myself. Of course I can couple alignments and structure in Jalview, Chimera or VMD but I don’t find such solution to be usable on the long run. To have the best of all worlds, I need to juggle all these applications.
I’ve been longing for some time already for a generic visualization platform that is able to show 2D and 3D data within the single environment, so I follow development of SecondLife visualization environment and Croquet/Cobalt initiatives. While these don’t look very exciting right now, I hope they will provide a common platform for different visualization methods (and of course visual collaboration environment).
But to be realistic, visual analytics in biology is not going to become a mainstream. It’s far more efficient to improve algorithms for multidimensional data analysis than to spend more time looking at pictures. I had already few such situations when I could see some weak signal and in a year or two it became obvious. But I’m still going to enjoy scientific visualization. I came to science for aesthetic reasons after all. 🙂
![Reblog this post [with Zemanta]](https://i0.wp.com/img.zemanta.com/reblog_e.png)